 |
地球にもっとも近い恒星-太陽はほとんど水素からできた巨大なガス球です.
中心部で水素がヘリウムに変換する核融合反応が起っていて,
その膨大なエネルギーによって光り輝いています.
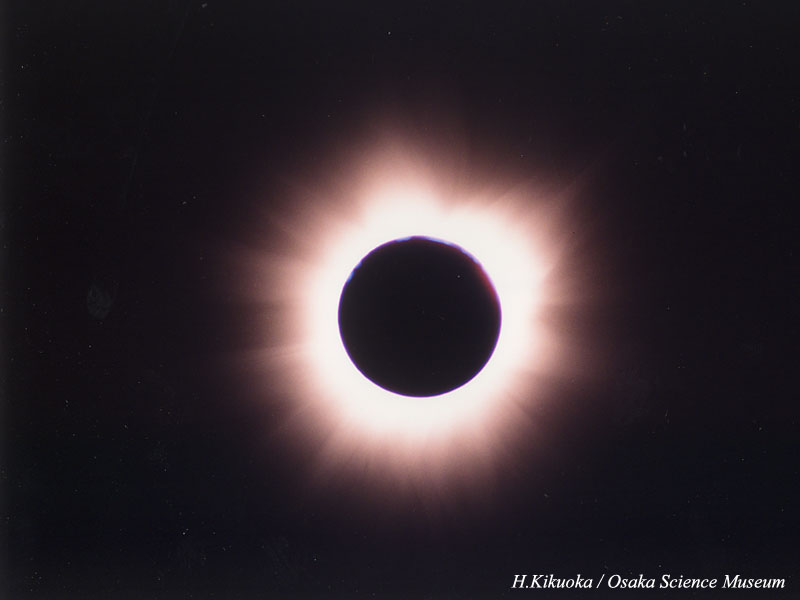
母なる太陽として,昔から人々は太陽を信仰の対象とし,畏敬の念を抱いてきました. 左:2001年6月21日のアフリカ皆既日食.撮影地はジンバブエ. 同国とザンビアとの国境付近にあるビクトリアの滝との合成写真. 実際には,ここでは日食は見えませんでした. 資料提供:菊岡秀多(大阪市立科学館) |
|
The Sun is a fixed star near the Earth.
It is a huge gas ball made from hydrogen.
In the central part,
the nuclear fusion reaction which hydrogen changes into helium has occurred,
and it is shining due to the huge energy.
The upper photograph is a total eclipse of the Sun in Africa on June 21, 2001. The photograph was taken in Zimbabwe. (It is a composite photograph with Victoria Falls. The solar eclipse could not actually be seen like this.) By courtesy of H.Kikuoka (Osaka Sciense Museum) 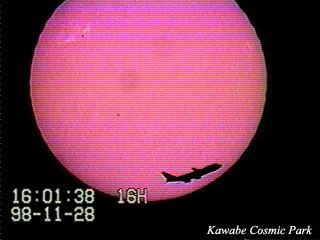 An airplane crossing the sun
By courtesy of the Kawabe Cosmic Park | |
Tracks of the Sun
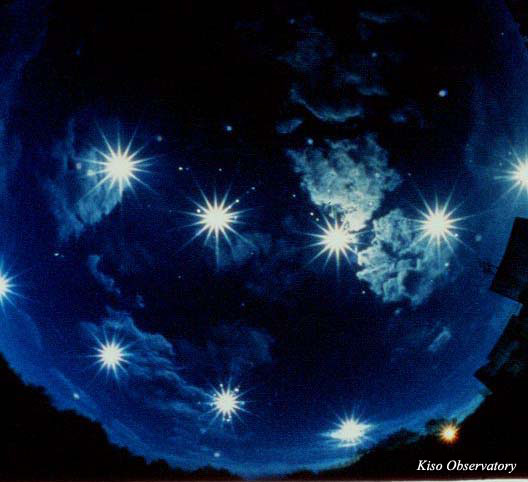 |
地球は太陽のまわりを公転しています.
その公転軌道面(黄道)に対して地球の赤道面が23度27分傾いているため,
太陽の南中高度や朝夕の出入りの方向,昼夜の長さが季節によって変化します.
左:木曽観測所で見た6月と12月の太陽の動き.魚眼レンズで撮影.
|
|
The Earth revolves around the Sun.
Since the equatorial plane of the Earth leans 23.5° to the revolutional orbit (ecliptic),
the altitude of meridian passege, the direction of sunset and sunrise,
and the length of day and night change with seasons.
The upper photograph is a track of the Sun in June and December seen in the Kiso Observatory. The top is the orbit of the Sun in June and the bottom is in December. It has been compounded in the picture into one photo.  A Track of the Sun of the Arctic Circle A Track of the Sun of the Arctic Circle
By courtesy of the Kiso Observatory / Univ. of Tokyo | |
Optical Spectra of the Sun

|
|||
|---|---|---|---|
|
We can see rainbow colors if we pass solar light through a prism.
The light decomposed according to the wavelength is called spectrum.
The intensity distribution of a continuum spectrum resembles blackbody radiation. In a continuum spectrum, a lot of absorption lines called Fraunhofer Lines are seen. 太陽の光(白色光)をプリズムに通すと虹の七色に分れます. このような波長別に分解された光のことをスペクトルと呼んでいます. 赤から紫まで連続的につながった虹色の太陽スペクトルの強度分布は, 絶対温度約6000度の黒体放射によく似ています. 連続スペクトル中にはフラウンホーファー線とも呼ばれる多数の暗線(吸収線)が見られます. | |||
 CaII H, K line |
 MgI b line |
 NaI D line |
 HI Hα line |
|
These are typical absorption lines of the Sun.
These absorption lines are connected with the discoverer's name and called Fraunhofer Lines.
On some absorption lines which are very conspicuous,
Fraunhofer labeled the lines with capital letters or a small letters such as A or b.
The absorption lines by the earth atmosphere were also contained in them.
代表的な太陽の吸収線です. 吸収線は発見者の名前からフラウンホーファー線(Fraunhofer lines)と呼ばれています. フラウンホーファーはよく目立つ吸収線にA, B等のアルファベットの大文字や小文字の記号をつけて識別しました. その中には地球大気による吸収線も含まれていました. By courtesy of Okayama Astrophysical Observatory / NAOJ | |||
|
|
If a slit is applied around east and west rim of the Sun,
and spectra are observed,
we can see that the positions of absorption lines shift from the wavelength of the basis,
because the spectral lines shift by the doppler effect which accompanies solar rotation.
In the upper left figure, A and B are the observed parts, and the arrows express the rotation direction. The lower picture shows corresponding spectra. We can derive the rotation speed of the Sun from the amount of the shift of this absorption line. 太陽の東と西の縁付近にスリットを当ててスペクトルを観測すると, 吸収線の位置がもとの波長よりも少しずれて見えます. これは太陽の自転に伴うドップラー効果によって, スペクトル線が偏移しているからです.
左上:太陽の模式図.A,Bは観測部分,矢印は自転方向.
AのスペクトルでもBのスペクトルでも, 地球大気に由来するスペクトル線は同じ波長です. しかし太陽に由来する吸収線の波長は少しずれています. すなわち,Aでは波長の短い方へ(青方偏移), Bでは波長の長い方へ(赤方偏移), 吸収線がずれて見えます. これは,Aでは,観測者へ近づいてくる方向で回転しているのに対し, Bでは,観測者から遠ざかる方向へ回転してためです. この吸収線のずれの大きさから,太陽の自転速度を求めることができます. | ||
|
Let's find a solar rotation speed !
By courtesy of the Okayama Astrophysical Observatory / NAOJ | |||

Corona
|
The region of thin gas is spread around the Sun is called the corona.
Since it is always obscured by strong solar light, we cannot see the corona.
But at the time of a solar eclipse, since the influence of the light of the Sun is lost,
we can see it.
The lower picture is the corona in a total eclipse of the Sun that was seen in Europe on August 11, 1999. A Kyoto University team observed it on various wavelengths using a CCD camera for the first time. | |

|
太陽周辺の高温(数百万度)で希薄なガスをコロナ(corona)と呼びます.
通常は,太陽本体からの強い光に邪魔されてコロナを見ることができません.
日食の時は太陽本体の光の影響がなくなるため,
目にすることができます.
ちなみに,コロナとは王冠の意味です.
左:1999年8月11日,京都大学チームが撮影した, ヨーロッパで見られた皆既日食におけるコロナ. 皆既継続時間は約2分10秒で,撮影地はトルコのエラジー市. 今回初めてCCDカメラを用いて,さまざまな波長で観測を行いました. 温度によってコロナの見え方が違うことがわかります. |
|
左上:連続光によるコロナ像.輝線ではなく,広い波長域の光で撮ったもので,
いろいろな温度成分の光が含まれています.
肉眼で見るコロナに最も近いイメージです.
左下:緑の画像.波長530.3nm(5303オングストローム)で見たコロナ. 鉄の13階電離イオンが出す輝線で, そのあたりの温度が約200万度であることを示しています. この光は緑色の波長域にあるので,グリーンライン(green line)とも呼ばれています. 右上:赤の画像.波長637.4nm(6374オングストローム)で見たコロナ. 鉄の9階電離イオンが出す輝線で,温度約100万度に対応しています. レッドライン(red line)とも呼ばれています. 右下:黄色の画像.波長569.4nm(5694オングストローム)で見たコロナ. ずっと低い温度成分です. By courtesy of Kwazan and Hida Observatory / Kyoto Univ. | |
Prominence

|
The prominent feature like red flame of gas in a solar corona is called prominence. The left was observed on October 22, 2000, the bottom was observed on February 8, 1999, useing the Flare Monitor Telescope of Hida Observatory. 太陽コロナのなかで, コロナの磁場によって支えられて“突起”のように見える部分をプロミネンス(prominence,紅炎)と呼びます.
左:2000年10月22日,京都大学附属飛騨天文台フレアモニタ望遠鏡にて撮影. By courtesy of the Hida Observatory / Kyoto Univ. |

| |
|---|---|
 GIF animation of the prominence on August 3, 2000. GIF animation of the prominence on August 3, 2000. GIF animation of the prominence on July 31, 1992.
Various prominence (Detailed explanation) GIF animation of the prominence on July 31, 1992.
Various prominence (Detailed explanation) | |
 GIF animation of left image
Flare

|
左:大規模な2リボンフレア.
京都大学附属飛騨天文台のドームレス太陽望遠鏡(DST)にて撮影.
フレアは,黒点領域の強い磁場のエネルギーが数秒から数分という短い時間に解放され,
数千万度の超高温プラズマや,KeVからMeVの高速電子・陽子ビームが生成され,
強いX線,γ線が放出される現象です. By courtesy of the Hida Observatory / Kyoto Univ. |
|
Flare is a phenomenon, where the surface near the sunspot suddenly brights
and a lot of high energy particles blow off to the interplanetary space.
It is supposed that the energy stored in the magnetic field of the corona over sunspots is released in a short time.
However, we do not know yet why such a rapid explosion takes place in a short time.
A top is the large scale flare observed useing the Domeless Solar Telescope (DST) of Hida Obsevatory.
The flare in active region of solar rim on March 9, 1995. (MPEG movie)
The flare which spreads after a filament blows off on August 29, 1997. (MPEG movie)
| |
Spicule

|
京都大学附属飛騨天文台のドームレス太陽望遠鏡(DST)による静穏領域の画像です.
スピキュール(spicule)とは, 太陽の彩層から針のように突き出て見えるガス体です. 左:3つの波長で見た太陽の縁のスピキュール.1985年8月18日撮影. |

|
飛騨天文台のドームレス太陽望遠鏡(DST)による静穏領域の画像です.
左:彩層中のスピキュール群(超粒状斑の境界に相当). 右:スピキュールのHα吸収線. さまざまな速度を持ったスピキュールが分解されています. |
|
Spicule is the gas which projects like a needle from chromosphere. A top is spicule of the solar rim observed through three wavelength on August 18, 1985. A bottom is spicule in chromosphere (left) and it's spectrum through Hα (right). These are silent regions observed useing the Domeless Solar Telescope (DST) of Hida Obsevatory. By courtesy of the Hida Observatory / Kyoto Univ. | |
Sunspot
|
太陽面に現れる暗い斑点が太陽黒点(sunspot)です.
典型的な黒点はほぼ円形で,中央がとくに暗く(暗部),
そのまわりを薄黒い部分(半暗部)がとり囲んでいます.
小さなもので直径約500km程度から,
大きなものは差し渡し10万kmにもおよびます.
黒点には強い磁場があり,
その強さは約100~4000ガウスもあります(ちなみに地球磁場は1ガウス以下).
左:多波長高分散画像.Hα中心波長から,+0.12nm(+1.2オングストローム) の連続光まで,段階的に波長域を変化させて撮影. 飛騨天文台のドームレス太陽望遠鏡(DST)による.
By courtesy of Hida Observatory / Kyoto Univ. |
|
The dark spot which appears in a solar surface is sunspot.
A typical sunspot is almost circular, it is dark in a center especially,
and the dusky part encloses the surroundings of it.
The size of the diameter of a sunspot is about 500km to 100,000km.
There is a strong magnetic field in a sunspot
and the strength exists no less than about 100-4000 gausses.
(Incidentally a geomagnetic field is 1 gauss or less)
A top is the high resolusion image of sunspot through various wavelength observed useing the Domeless Solar Telescope (DST) of Hida Obsevatory | |

| |
|
A top is sunspot and it's spectrum observed on July 14, 1978, useing 65cm Solar Coude Telescope of Okayama Astrophysical Observatory.
If the spectrum of a sunspot is observed, we can see the signs that the absorption line is wide, and branches more than 3. This is based on the influence of the strong magnetic field of a sunspot, and is called Zeeman Effect. 上:黒点のスペクトル. 1978年7月14日,国立天文台岡山天体物理観測所の65cm太陽クーデ望遠鏡にて撮影. 左は分光器のスリットのモニター像. 右は左のスリット部分から入射した光をスペクトルに分解. 黒点の吸収線(ここではFeI)は広くひろがり,分岐しています. 図上の↓は地球大気による吸収線です. 黒点のスペクトルを観測すると, 吸収線が広がっている上に3本あるいはそれ以上に分岐する様子が見られます. 吸収線が強いのは主に黒点の温度が光球より低いためですが, 線が分岐するのは黒点の強い磁場の影響によるもので, ゼーマン効果(Zeeman effect) と呼ばれる現象です. 太陽黒点のスペクトルにおけるゼーマン効果は, 1908年からウィルソン山天文台のヘール(G.E. Hale)によって系統的に観測され, その結果,黒点の磁場の極性は約11年毎に反転し, 約22年で元に戻ることが明らかになりました. By courtesy of the Okayama Astrophysical Observatory / NAOJ | |
Granule

|
粒状斑(granule)とは,太陽表面に見える粒状の濃淡で,
10分ほどの寿命で現れたり消えたりします.
左:粒状斑の高分散画像.光球面中央. 飛騨天文台ドームレス太陽望遠鏡(DST)にて1999年8月30日撮影.
|
|
Granule is the granular shade which is visible to the solar surface.
It appears in about 10 minutes, or disappears.
The upper left is the high resolusion image of granule observed on August 30, 1999, useing the Domeless Solar Telescope (DST) of Hida Obsevatory. By courtesy of the Hida Observetory / Kyoto Univ. | |
 Go to Submenu
 Go to Menu